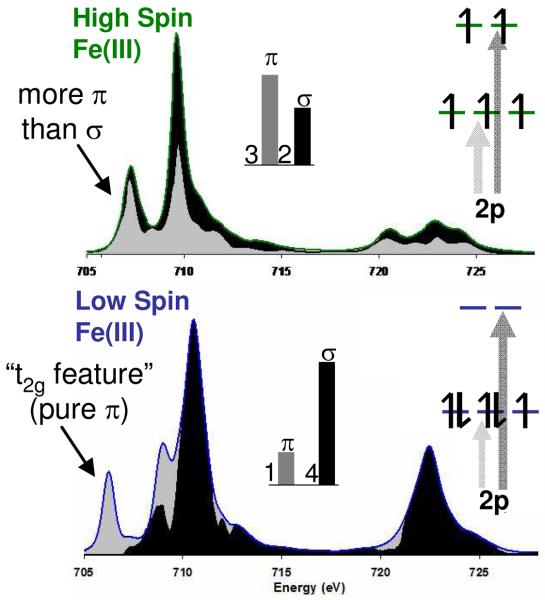
Figure 8.
Comparison of the Fe L-edges of a typical high spin Fe(III) complex (top) and a low spin Fe(III) complex (bottom). Orbital population inserts indicate the origin of σ and π intensity (arrows) which then distribute over the states due to e-e repulsion as indicated by black (σ) and grey (π), DOS.

