
Figure 4.
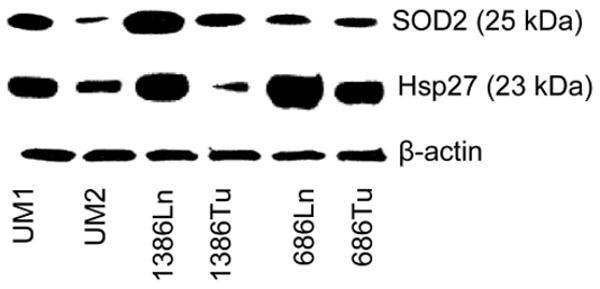
Western blot analyses of SOD2 and Hsp27 on OSCC cells. The expression levels of SOD2 and Hsp27 were determined for the paired UM1/UM2, 1386Ln/Tu, and 686Ln/Tu cell lines as described. The level of β-actin is shown as loading control. The results represent three independent experiments with similar findings.