FIG. 20.

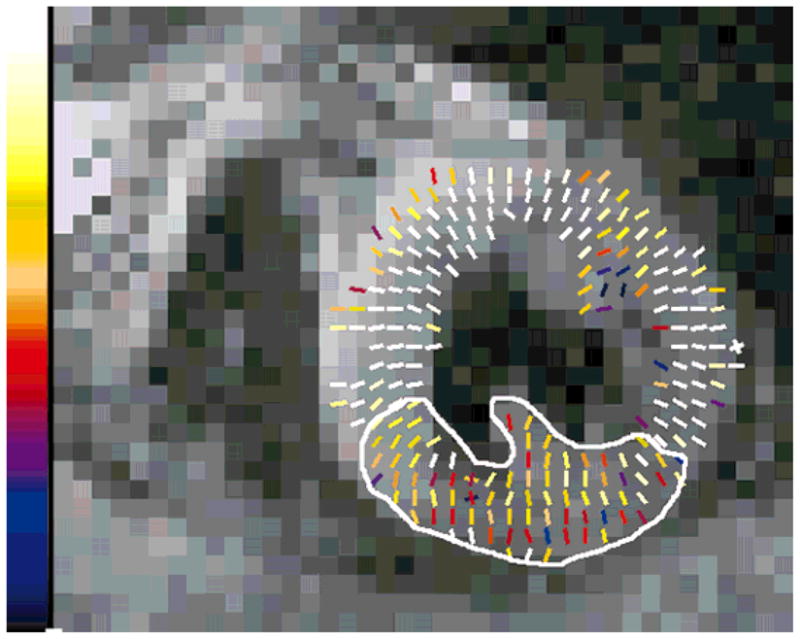
Strain map depicting myocardial lengthening. This map corresponds to the systolic function of the slice shown in Fig. 18. Maximum scale corresponds to 25% strain. The akinetic zone is depicted in the circumscribed area.

Strain map depicting myocardial lengthening. This map corresponds to the systolic function of the slice shown in Fig. 18. Maximum scale corresponds to 25% strain. The akinetic zone is depicted in the circumscribed area.