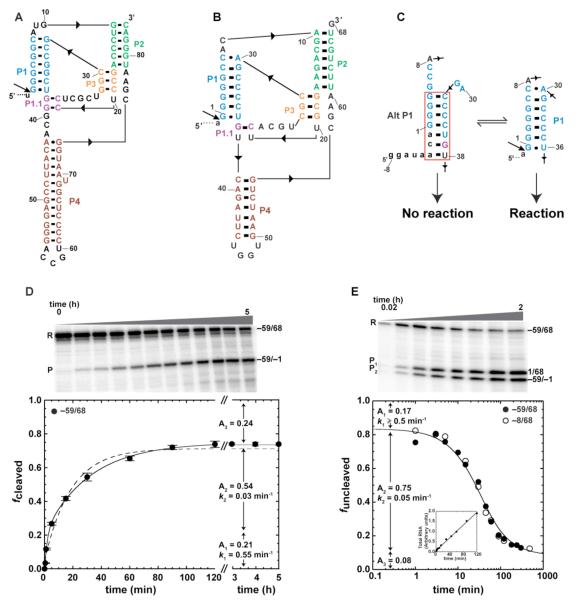
FIGURE 1.
Self-cleavage of human CPEB3 WT ribozyme. (A) Secondary structure of HDV ribozyme (40). (B) Secondary structure of CPEB3 ribozyme (14). (C) Equilibrium between Alt P1 and P1. See Fig. S3 for details. (D) Standard self-cleavage reactions initiated by addition of 10 mM MgCl2. RNA was 5′-end labeled with [γ-32P]GTP during transcription. Plots of fcleaved versus time. Each data point is the average of at least two trials ± the standard error of the experiments. Data were well fit to double-exponential eq 2 (solid line, R2 = 0.999). Poor fitting to single-exponential eq 1 is provided for comparison (dashed line, R2 = 0.993). (E) Co-transcriptional self-cleavage reactions. RNA was body-labeled with [α-32P]GTP during transcription. Plots of funcleaved versus time, where R/(R+P1+P2) represents the uncleaved fraction. Each data point is the average of at least two trials. Data for both −59/68 (●) and −8/68 (○) were fit separately to eq 3. In this fit, which is for −59/68, A in eq 3 was fixed at 0.08±0.007, as ascertained from plateau values (avg. ± s.d.) averaged across 2-8 h time points for both constructs. Inset shows that the rate of transcription was constant throughout the reaction, as demanded by eq 3. Gels for panels (D) and (E) are 10% denaturing.

