
Figure 2.
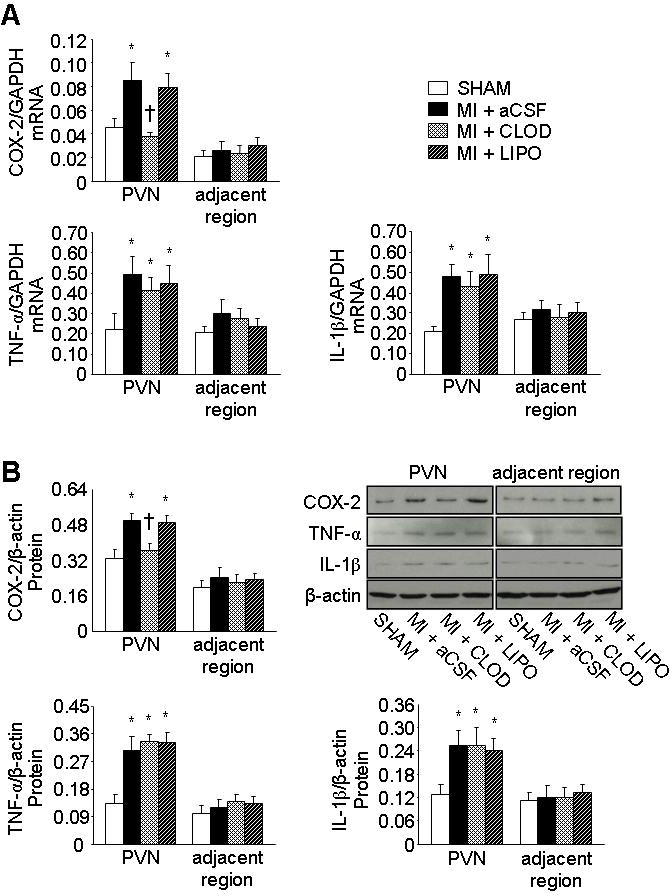
Quantitative comparison of mRNA expression (A) and protein levels (B) for COX-2, TNF-α and IL-1β from the PVN and adjacent regions of hypothalamus of each treatment group. Representative Western blots of COX-2, TNF-α, IL-1β and β-actin are shown in figure B. Values were expressed as mean ± SEM (n=5 to 8 for each group). *P<0.05 vs SHAM in same region, †P<0.05, MI+treatment vs MI+aCSF in same region.