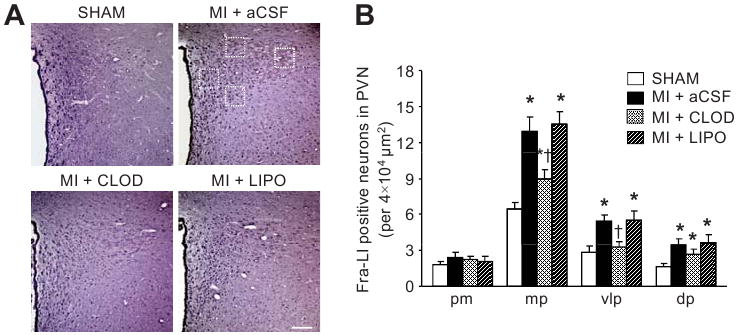
Figure 4.

Expression of Fra-LI activity in the PVN. (A) Representative sections from each group showing Fra-LI immunoreactivity in PVN neurons. Dark dots indicate Fra-LI positive neurons. Squares (dotted lines) indicate the regions in panel A from which the data in panel B are derived. Scale bar=200 μm. (B) Quantification of Fra-LI positive neurons in 4 different regions of the PVN. Values are expressed as mean ± SEM (n=4 for each group). *P<0.05 vs SHAM. †P<0.05, MI+treatment vs MI+aCSF. pm indicates posterior magnocellular; mp, medial parvocellular; vlp, ventrolateral parvocellular; dp, dorsal parvocellular.
