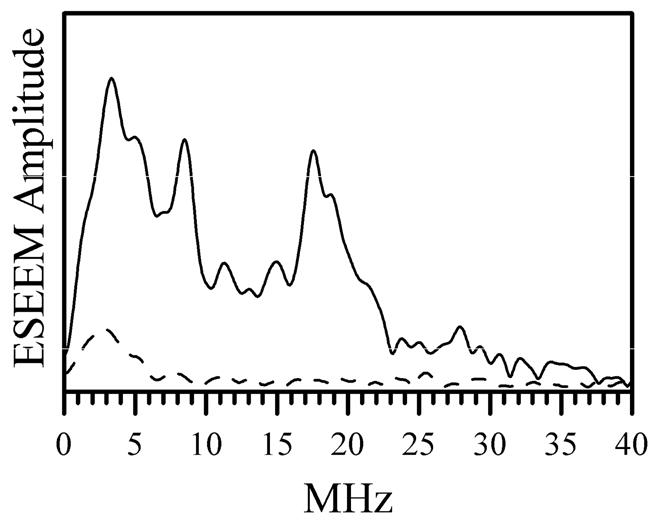
Figure 2.

Amplitude Fourier transformation spectra of normalized two-pulse ESEEM spectra of 33S-labeled (i.e., reduced with 33S-enriched sulfite, solid trace) and unlabeled (dashed trace) chloride-depleted wt hSO at pH 5.8 obtained at gY EPR turning point. Experimental conditions: mw frequency, 29.51 GHz; Bo = 1074.1 mT; mw pulses, 9 and 15 ns; temperature, 21 K, enzyme concentrations, 600 μM for trace 1 and 430 μM for trace 2. Since the only difference between the samples was in the enrichment with magnetic isotope of sulfur (33S, natural abundance is 0.76%), the lines observed in the spectrum shown by the black trace are attributed to 33S.
