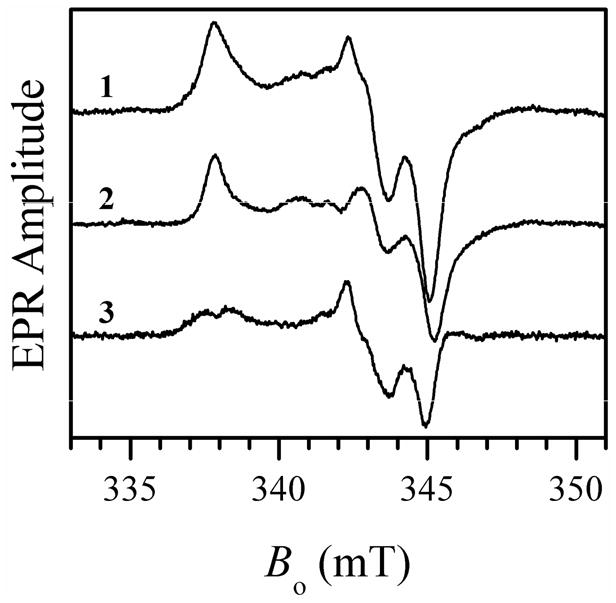
Figure 5.

X-band CW EPR spectra of wt At-SO at pH 6.0 with added 100 mM NaCl (trace 1) and without NaCl (trace 2). Trace 3 represents the difference between traces 1 and 2 showing the contribution of the lpH SO spectrum obtained after addition of chloride. Experimental conditions: mw frequency, 9.483 GHz; mw power, 2 mW; magnetic field modulation amplitude, 0.1 mT; temperature, 77 K, enzyme concentration, 460 μM. Estimated relative concentrations of Mo(V) centers are 35% and 42% for traces 1 and 2, respectively.
