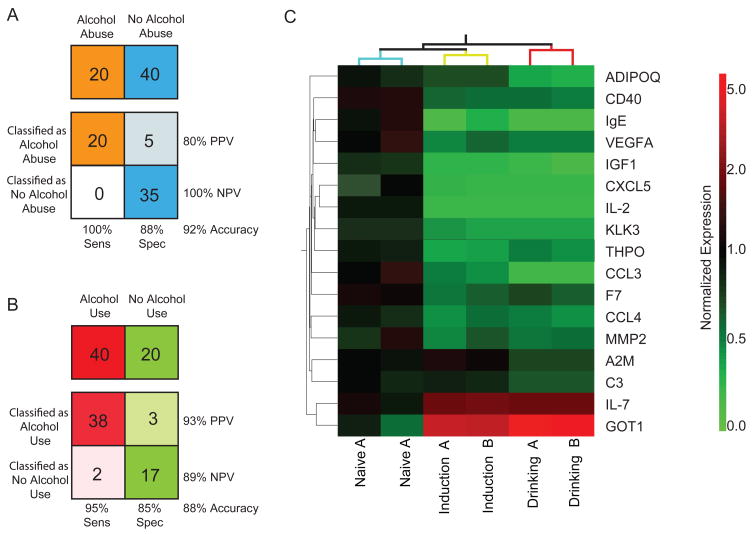
Figure 2.
(A) Using a three protein panel and Support Vector Machine (SVM) classification algorithm, alcohol abuse samples (Drinking) were correctly classified from non-alcohol abusing samples (Naïve and Induction) with 92% accuracy and 100% sensitivity. (B) Using a fourteen protein panel and SVM classification algorithm, alcohol using samples (Induction and Drinking) were correctly classified from non-alcohol using samples (Naïve) with 88% accuracy and 95% sensitivity. (C) Heatmap representation of the seventeen protein biomarker panel and clustering of the sample groups. Mean expression levels, normalized to a mean naïve level of 1, for each drinking state and time point were clustered by condition. Increased abundance, compared to mean Naive, is presented in red and reduced abundance in green. Independent samples from each drinking state clustered together.

