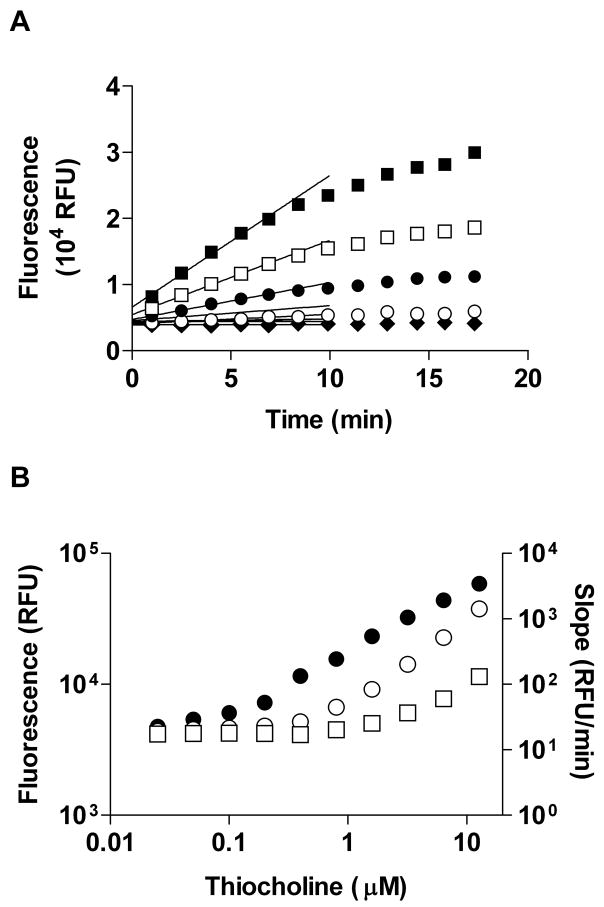
Figure 2.
(A). Time-dependent fluorescence intensity after incubating BES-Thio with representative concentrations of thiocholine: 0 μM (◆), 0.4 (○), 1.6 (●), 3.2 (□), and 6.4 μM (■). The lines show a linear fit of RFU data points observed between 0–7 min. Data points represent the average of triplicate samples and error bars are smaller than the data markers. (B) A replot of data shown from A for RFU values (left axis) observed at 1 min (□), 10 min (○), and the slope of RFU development calculated by the linear fit from Fig 2A (●, right axis) versus the thiocholine concentrations.

