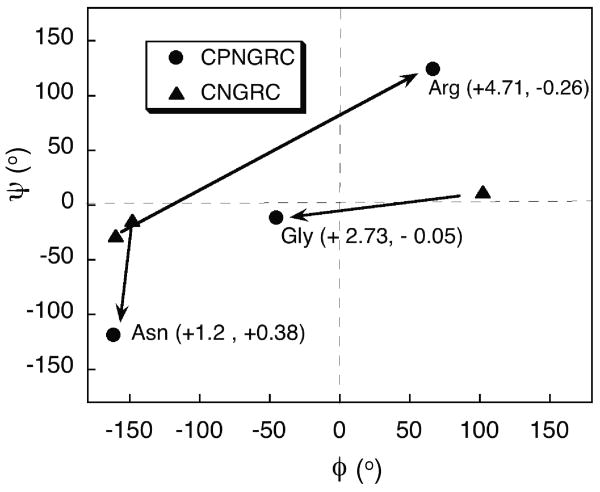
Figure 10.
Ramachandran plot of the APN recognition elements in CNGRC (σ) and CPNGRC (λ) indicating rather large changes in backbone torsion angles. In parentheses next to the CPNGRC points are the ppm changes in chemical shift (CNGRC vs. CPNGRC), observed for the alpha carbon and alpha proton resonances, respectively.

