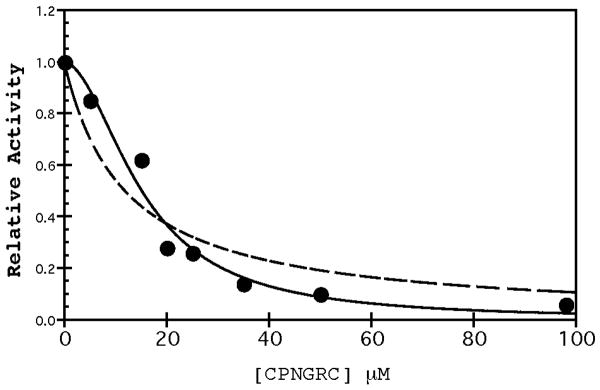
Figure 12.
Sigmoidal dose-response curve for CPNGRC. The velocity data from Figure 1B in the presence of CPNGRC was fit using a simple mixed inhibition (dotted line) or equation 5 (solid line) for the two site binding model. The R value for the simple mixed curve fitting is 0.950; whereas, the fitting

