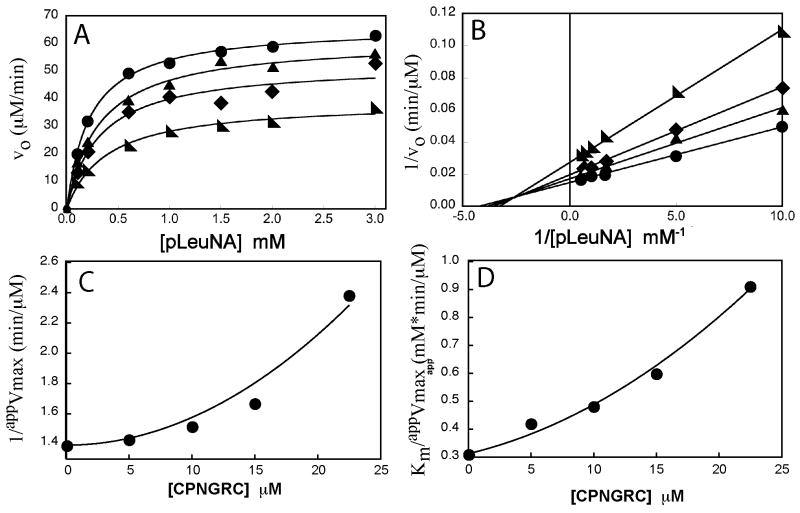
Figure 2.
Steady-state kinetic profile for APN in the presence of CPNGRC. Panels A and B illustrate velocity and double reciprocal plots of the same experimental data for CPNGRC. The concentrations of CPNGRC are 0 μM (λ), 10 μM (σ), 15 μM (ν), and 23 μM (◣). Panels C and D are replots of the intercepts (1/Vmax) and slopes (Km/Vmax), respectively, obtained from the double reciprocal plots (panel B) exhibiting a quadratic dependence on the inhibitor concentration.

