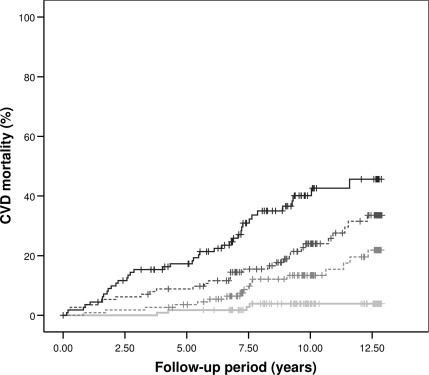
Figure 1.
Unadjusted Kaplan–Meier curves for CVD mortality among the 451 patients with diabetic nephropathy according to quartiles of GDF-15 levels (≤969; 970–1,327; 1,328–2,172; and ≥2,173 ng/l, respectively). First quartile (light gray line); second quartile (light gray dotted line); third quartile (dark gray dotted line); and fourth quartile (black line). Log-rank test resulted in P < 0.001.

