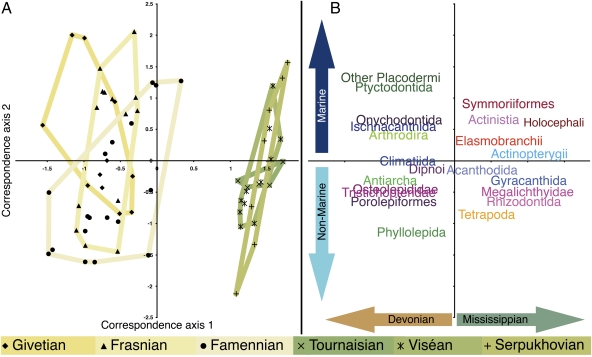
Fig. 3.
Faunal comparison using CCA of the later Devonian and Mississippian sites and taxa. Data were not grouped a priori by either stage or environment. (A) Ordination of sites along the first two correspondence axes based on raw diversity of taxa (n = 66). Polygon colors adhere to the RGB color code of the Commission for the Geological Map of the World. (B) Ordination of taxonomic groups (n = 22) and representation of gradients determining placement of sites along the axes. The first correspondence axis represents a temporal gradient between the Devonian and Mississippian, whereas the second axis corresponds to relative salinity.

