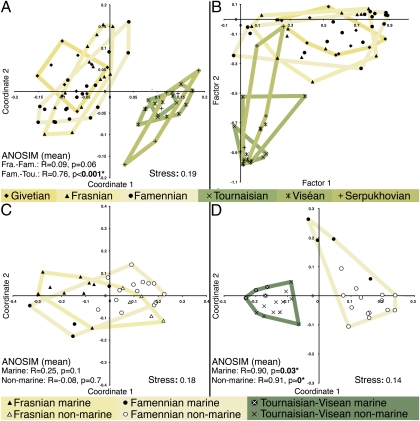
Fig. 4.
Faunal comparisons. (A) NMDS for all sites based on raw diversity and Bray–Curtis distances (n = 66). (B) FA plot for all sites based on raw diversity (n = 66). Factor 1 (39.68% of variance) is positively correlated with the Devonian nonmarine fauna presented in the CCA results (Fig. 2B and SI Appendix). Factor 2 (22.10% of variance) is negatively correlated with members of Mississippian fauna (SI Appendix). (C) NMDS of Frasnian and Famennian sites based on relative diversity and Bray–Curtis distance (n = 32). (D) NMDS of Famennian and Tournaisian-Viséan sites based on relative diversity and Bray–Curtis distance (n = 34).

