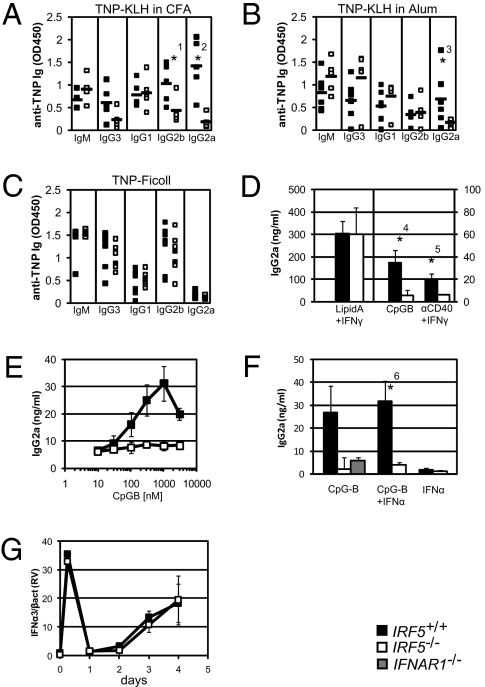
Fig. 2.
Defective Ig antibody responses in Irf5−/− mice and B cells. Sera from Irf5+/+ (filled squares) and Irf5−/− (empty squares) mice immunized for 14 days with either (A) TNP-KLH in CFA, (B) TNP-KLH in Alum, or (C) TNP-Ficoll were assayed by ELISA for relative amounts of anti-TNP IgM, IgG3, IgG1, IgG2b, and IgG2a as indicated. Averages are represented by filled rectangles. Linear range OD450 values are shown (n = 5–7 mice per group). (D) Supernatant from Irf5+/+ and Irf5−/− purified B cells stimulated in vitro with either lipid A plus IFNγ (n = 4), CpG-B (n = 10), or anti-CD40 plus IFNγ (n = 3) for 4 days were analyzed for IgG2a secretion by ELISA. Note that the vertical axis scale for lipid A plus IFNγ differs from CD40 plus IFNγ and CpG-B. Mean and standard deviation (SD) are shown. (E) As in D, IgG2a ELISA was performed on supernatant following a dose curve of CpG-B (10, 30, 100, 300, 1,000, and 3,000 nM) (n = 3). (F) IgG2a ELISA as in D on supernatants of Irf5+/+, Irf5−/−, and Ifnar1−/− (intermediate) B cells following CpG-B alone (n = 4), CpG-B plus IFNα (n = 4), or IFNα alone (n = 2) treatment for 4 days. (G) Real-time RT-PCR for IFNα3 mRNA in Irf5+/+ and Irf5−/− B cells stimulated with CpG-B for the indicated number of days. Mean and SD relative values (RV) normalized to β-actin expression from three independent experiments are shown. *1P = 0.032; *2P = 0.002; *3P = 0.097; *4P = 0.000; *5P = 0.073; *6P = 0.002.

