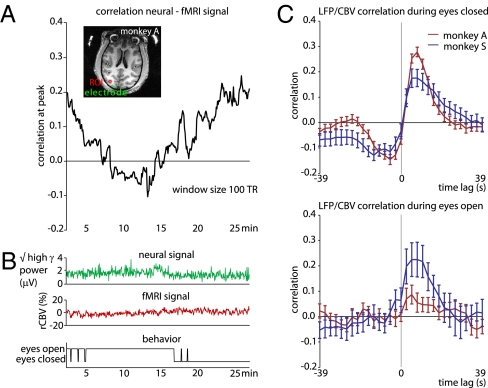
Fig. 5.
Nonstationarity of coupling between fMRI and LFP signal. (A) Example where the use of a sliding window (100 TR) revealed large changes in the fMRI/LFP correlation strength over the course of a run. (B) The corresponding high-frequency LFP power and mean voxel time course from the ROI did not visibly change during this run (top and middle), although the opening and closure of the monkey's eyes appeared linked to the correlation strength (bottom). (C) Analysis of all runs from both monkeys A and S revealed stronger neurovascular coupling when the monkeys’ eyes were mostly (>80% of the time) closed (top) to when they were mostly open (bottom). Monkey V was excluded from this analysis, as her eyes were never closed for more than a few seconds.

