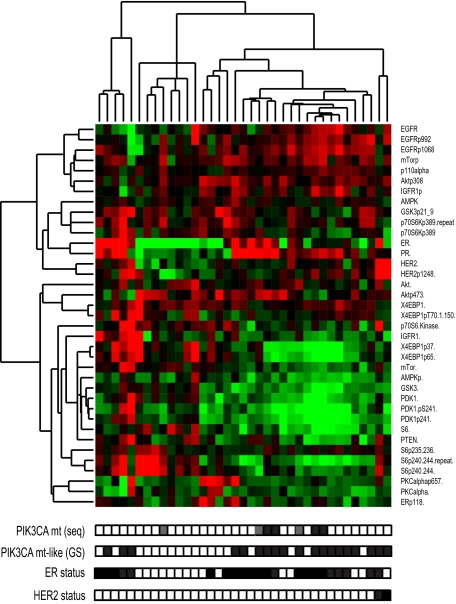
Fig. 3.
PIK3CA mt samples and mt-like samples have show decreased expression of downstream PI3K/AKT/mTOR proteins. Heat map represents unsupervised hierarchical clustering of BCs and corresponding protein data from the MDACC cohort. Patients are represented horizontally: PIK3CA mt status by sequencing (seq), according to gene signature (GS), ER and HER2 (FISH) status are indicated by filled (positive) and white (negative) boxes and Exon 9 and 20 mutations are gray and black boxes, respectively; Clustering was performed by using Pearson correlation metric and centroid linkage. Proteins and phosphorylated proteins are indicated vertically. Red represents over-expression, green represents underexpression.

