Fig. 1.
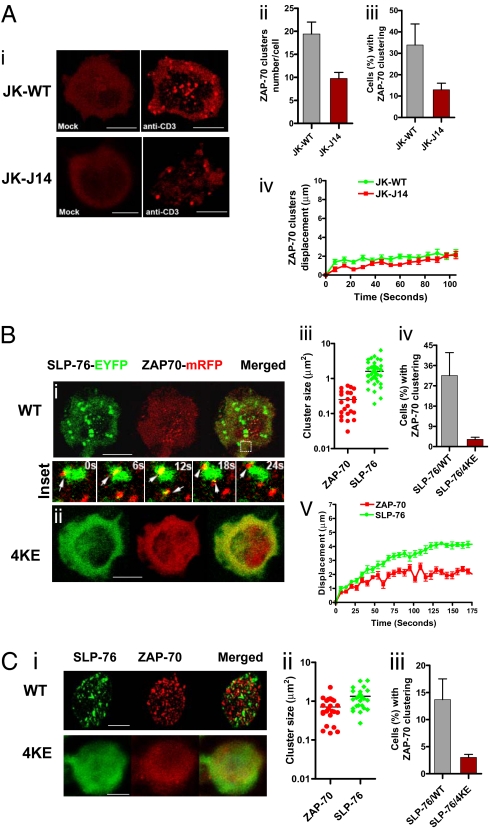
SLP-76 regulates ZAP-70 microcluster formation. (A) SLP-76 deficient J14 cells show reduced levels of ZAP-70-mRFP clustering relative to SLP-76 positive WT cells. Confocal images of ZAP-70-mRFP cluster formation and distribution at the interface of transfected Jurkat WT or J14 cells and anti-CD3–coated slides (i). Jurkat WT cells expressing ZAP-70-mRFP on anti-CD3–coated slides (Upper Right) or on control anti-Ig–coated slides (Upper Left); SLP-76 deficient J14 cells expressing ZAP-70-mRFP on anti-CD3–coated slides (Lower Right) or on control anti-Ig–coated slides (Lower Left). (Scale bars, 10 μm.) Histograms showing the number of ZAP-70-mRFP clusters per cell (ii), the percentage of cells expressing ZAP-70-mRFP clusters (iii) and displacement values of ZAP-70-mRFP clusters in WT (green curve) and J14 (red curve) cells over time as determined by Volocity software (iv). Values for motility were calculated by Volocity software from the time-lapse movies. (B) Inhibition of ZAP-70-mRFP clustering by coexpression of SLP-76 4KE mutant. Confocal images of ZAP-70-mRFP (red) and SLP-76-EYFP (green) microclustering at the interface between transfected J14 cells and anti-CD3–coated coverslips. J14 cells were cotransfected with ZAP-70-mRFP and SLP-76-EYFP WT (i) or ZAP-70-mRFP and SLP-76-EYFP 4KE mutant (ii). (Insets) The transient interactions between ZAP-70-mRFP microclusters and SLP-76-EYFP WT microclusters in selected regions over 24 s. (Scale bars, 10 μm.) Histograms show cluster sizes of ZAP-70-mRFP and SLP-76-EYFP WT (iii), percentage of cells with ZAP-70 clustering in presence of SLP-76 WT or 4KE mutant expression (iv) and displacement values of ZAP-70 clusters (red curve) and SLP-76 clusters (green curve) over 175 s (v). (C) SLP-76 4KE impairs ZAP-70-mRFP cluster formation in human primary T cells. Confocal images of ZAP-70-mRFP (red) and SLP-76-EYFP (green) microclustering at the interface between transfected human primary T cells and anti-CD3–coated coverslips. Human primary T cells were cotransfected with ZAP-70-mRFP and SLP-76-EYFP WT (i, Upper) or ZAP-70-mRFP and SLP-76-EYFP 4KE mutant (i, Lower). (Scale bars, 5 μm.) Histograms show cluster size of ZAP-70-mRFP and SLP-76-EYFP (ii) and percent of cells with ZAP-70 clusters in SLP-76 and SLP-76 4KE cotransfected cells (iii).

