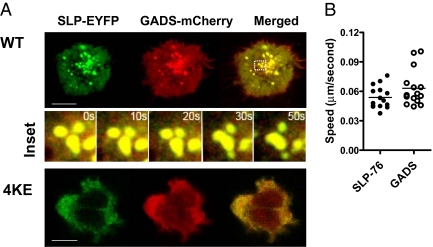
Fig. 3.
The SLP-76 4KE mutant disrupts GADS microcluster formation. Confocal images of GADS-mCherry and SLP-76-EYFP cluster formation and distribution at the interface of transfected cells and anti-CD3–coated slides (A). Jurkat cells were cotransfected with and GADS-mCherry (red) and SLP-76-EYFP WT (green) (Upper) or with GADS-mCherry and SLP-76-EYFP 4KE mutant (Lower). (Scale bars, 10 μm.) Insets show time-lapse series of GADS and SLP-76 WT microcluster movement in selected regions imaged over 50 s. Histogram shows the speed (μm/s) traveled by individual clusters over time within cells cotransfected with SLP-76-EYFP WT and GADS-mCherry (B).

