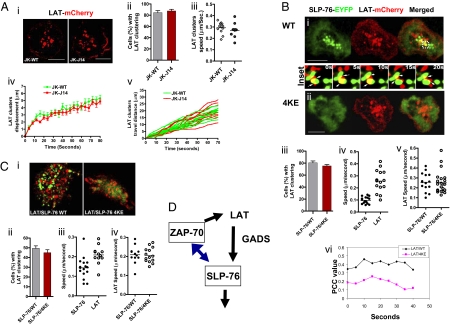
Fig. 4.
LAT clustering occurs independently of SLP-76. (A) LAT-mCherry clustering in Jurkat WT or SLP-76 deficient J14 cells. Confocal images of LAT-mCherry cluster formation and distribution at the interface of transfected cells and anti-CD3–coated slides (i) LAT-mCherry microcluster formation in Jurkat WT cells (Left) or in SLP-76 deficient J14 cells (Right). (Scale bars, 10 μm.) Histograms show the percentage of cells expressing LAT-mCherry clusters in WT (gray bar) and J14 (red bar) cells (ii) values of speed of movement of LAT clusters (iii), displacement values of LAT-mCherry clusters (iv) and distance traveled over time by individual LAT clusters (v) in WT Jurkat cells or J14 cells. Values for motility were calculated by Volocity software from the time-lapse movies. (B) LAT clustering in J14 cells cotransfected with SLP-76 WT or 4KE mutant. Confocal images of LAT-mCherry and SLP-76-EYFP cluster formation and distribution at the interface of transfected J14 cells and anti-CD3–coated slides. J14 cells were cotransfected with LAT-mCherry (red) and SLP-76-EYFP WT (green) (i) or with LAT-mCherry (red) and SLP-76-EYFP 4KE mutant (ii). Insets between i and ii show the movement and interaction of LAT-mCherry and SLP-76-EYFP clusters in selected regions over 20 s. (Scale bars, 10 μm.) Histograms show the percentage of cells with LAT clusters in Jurkat cells cotransfected with SLP-76-EYFP WT (gray bar) or SLP-76-EYFP 4KE mutant (red bar) (iii), the speed (μm/s) traveled by individual SLP-76 versus LAT clusters in cells coexpressed with LAT-mCherry and SLP-76-EYFP WT (iv), the speed of LAT clusters in cells cotransfected SLP-76-EYFP WT or 4KE mutant (v) and Pearson's correlation coefficient (PCC) values of the overlap of LAT-mCherry and SLP-76-EYFP WT or LAT-mCherry and SLP-76-EYFP 4KE over a time-course (vi). Values for motility and PCC were calculated by Volocity software from the time-lapse movies. (C) LAT clustering is not affected in primary T cells expressing SLP-76 4KE mutant. Confocal images of LAT-mCherry and SLP-76-EYFP cluster formation and distribution at the interface of transfected human primary T cells and anti-CD3–coated slides (i). Human primary T cells were cotransfected with LAT-mCherry (red) and SLP-76-EYFP WT (green) (Left) or with LAT-mCherry (red) and SLP-76-EYFP 4KE mutant (green) (Right). Histograms show the percentage of cells with LAT clusters in human primary T cells cotransfected with SLP-76-EYFP WT or 4KE mutant (ii), the speed (μm/s) traveled by individual SLP-76 versus LAT clusters in cells coexpressed with LAT-mCherry and SLP-76-EYFP WT (iii) and the speed of LAT clusters in cells cotransfected SLP-76-EYFP WT or 4KE mutant (iv). Values for motility were calculated by Volocity software from the time-lapses movies. (D) Feedback regulation of ZAP-70 clustering by SLP-76, whereas LAT clustering is independent. Phosphorylation of LAT is needed to recruit GADS and SLP-76 into the LAT signalosome. Disruption of LAT signaling can interfere with clustering of GADS and LAT. Similarly, disruption of GADS affects SLP-76 clustering. We show that ZAP-70 clustering is partially dependent on SLP-76. LAT to GADS to SLP-76 is therefore not a strictly linear pathway but involves a feedback loop where ZAP-70 and GADS clustering is dependent on SLP-76. By contrast, LAT clustering is unaffected by the loss of SLP-76 clustering.

