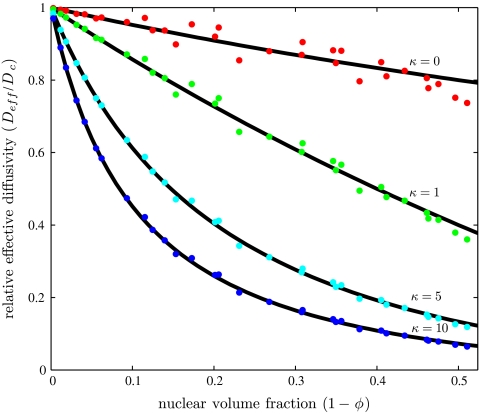
Fig. 3.
The relative effective diffusivity plotted as a function of nuclear volume fraction (up to the maximum π/6 ≈ 0.52), for multiple values of the equilibrium constant. Each dot represents the effective diffusivity found computationally for the indicated equilibrium constant and a particular set of geometric parameters chosen from the following ranges: r∈[1,6], h∈[10,30], a∈[0.1,5], and l∈[6,24]. The solid lines are the analytical expression Eq. 6; see text for details.

