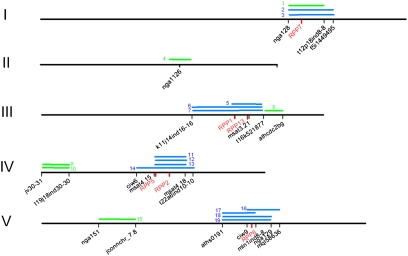
Fig. 1.
Physical map locations of 19 resistance QTLs against H. arabidopsidis ex parasitica. Single dominant loci are depicted in blue bars, whereas additive, epistatic, and recessive loci are depicted in green bars. The markers flanking the mapping intervals are shown below in black. Cloned RPP genes are indicated in red. Chromosomes are pictured in scale and numbered I–V. The parental source and recognition specificity of the QTLs are reported in Tables S2 and S3, with the corresponding reference number.

