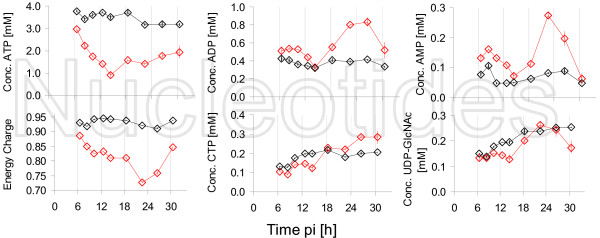
Figure 10.
Intracellular concentrations of selected nucleotides and energy charge after infection with influenza virus from NIBSC. Infection was performed with NIBSC (red) and mock-infection (black). Symbols represent average of three wells of one six-well plate and error bars the respective standard error of the mean.

