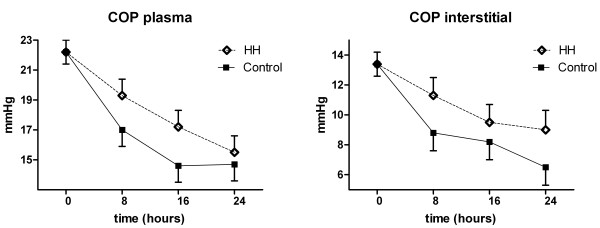
Figure 2.
Colloid osmotic pressure during cooling. Mixed effects model with mean and standard error.
a) Colloid osmotic pressure in plasma. Mixed effects model with mean and standard error. Overall p < 0.001. Changes 24 vs. 0 hours. p < 0.001 (both groups). b) Colloid osmotic pressure in interstitial tissue. Mixed effects model with mean and standard error. Overall p < 0.001. Changes 24 vs. 0 hours. p = 0.001/p < 0.001 (HH/Control).

