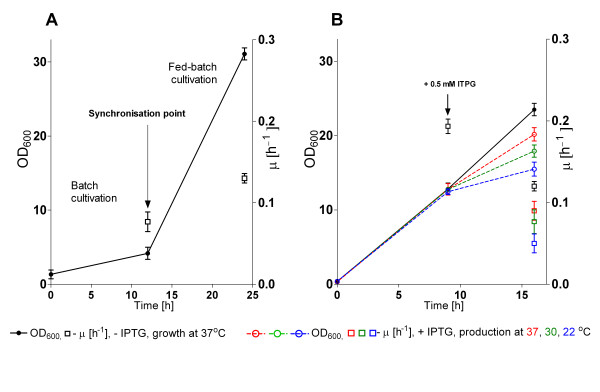
Figure 2.
Growth of the RI expression library consisting of 45 different expression vectors propagated in E. coli RV309 pibpfxsT7lucA in 96 microwell plates by the EnBase® technology. (A) Inocculum preparation and (B) 96 microwell plate expression cultures with plates which were non-induced (closed circle) or set to different postinduction temperatures at the time of induction (37°C - red, 30°C - green, 22°C - blue). Bars indicate the SD of all cultures of a whole plate (including all different vectors). OD600 - circles, specific growth rate - squares (average specific growth rate in the time period before).

