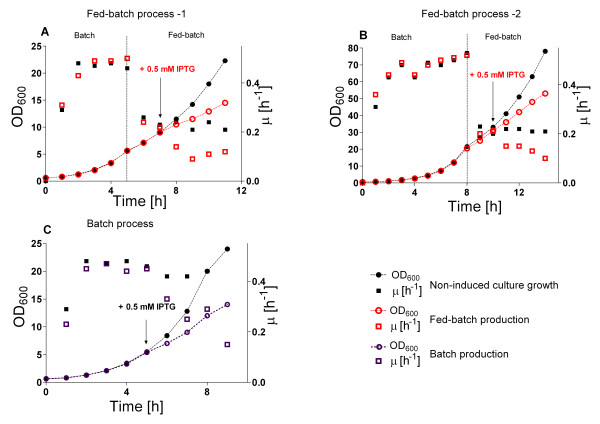
Figure 8.
Growth curves of E. coli RV308/pibpfxsT7lucA/pCTUT7MBP-RI cultures during the 6 × His-MBP-RI protein production process in a fed-batch bioreactor with exponential glucose feeding (A and B) and in a batch culture (C). Cultivations were performed at 37°C and induction was performed with 1 M IPTG. (A) Bioreactor process 1: fed-batch operation was started at OD600 = 6, induction at OD600 = 9 after the specific growth rate reached μ = 0.22 h-1. (B) Bioreactor process 2; fed-batch operation was started at OD600 = 22, induction at OD600 = 31 after the specific growth rate reached μ = 0.22 h-1. (C) Growth curve of the batch bioreactor process. Induction was performed at OD600 ≈ 5 at a specific growth rate of μ ≈ 0.45 h-1.

