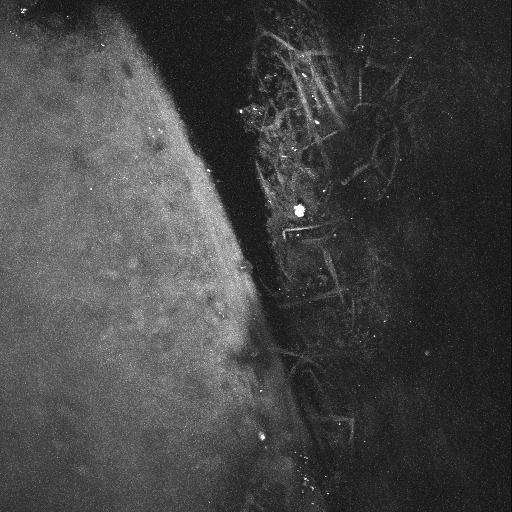
Figure 2.

A 3D reconstruction of the cornea/TM region shown in Figure 1. The region of TM/cornea shown in Figure 1 was imaged by AF at 1 µm intervals. A total of 100 z-sections were projected into a 3D-animation with rotation about the y-axis. Rotation begins with a side-on view of the tissue. The AF signal from the collagen ‘beams’ within the TM are quite evident due to the low AF signal from the surrounding fluid spaces. In contrast, the AF signal from the cornea is fairly homogenous.
