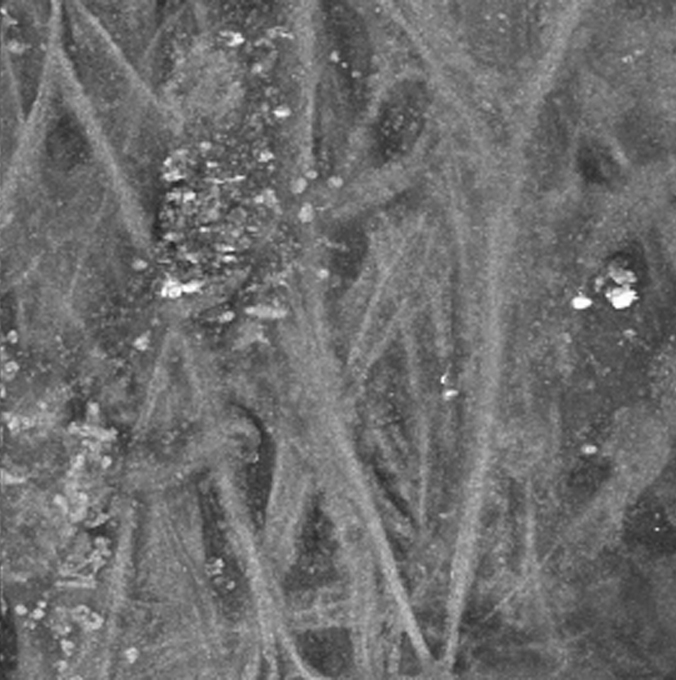
Figure 4.

A 3D reconstruction of the TM region shown in Figure 3. The region of TM shown in Figure 3 was imaged by AF at 1 µm intervals. A total of 75 z-sections were projected into a 3D-animation with rotation about the y-axis. The AF signal from the collagen within the TM reveals a meshwork of collagen structures interwoven with what appears to be fluid spaces. The animation begins with a view of the aqueous face of the TM; rotation by 180 degrees reveals an open pore-like structure that penetrates the entire thickness scanned. The non-fibrous structure present at the aqueous surface can be viewed through the pore.
