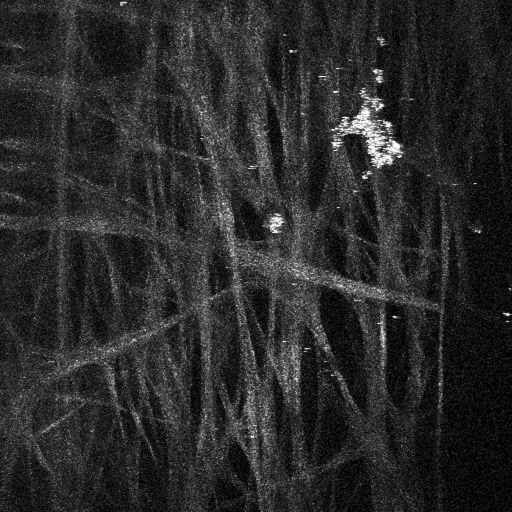
Figure 6.
A 3D reconstruction of the TM region from Figure 5. The region of TM shown in Figure 5 was imaged at 0.5 µm intervals (for a total of 100 z-sections). For this animation, only the SHG signal was projected into a 3D-animation. The animation begins with a view of the aqueous face of the TM, with rotation about the y-axis. While the SHG signal is weaker than the AF signal (animation in Figure 4), it shows qualitatively the same interwoven 'beam' structures surrounded by fluid-filled spaces.

