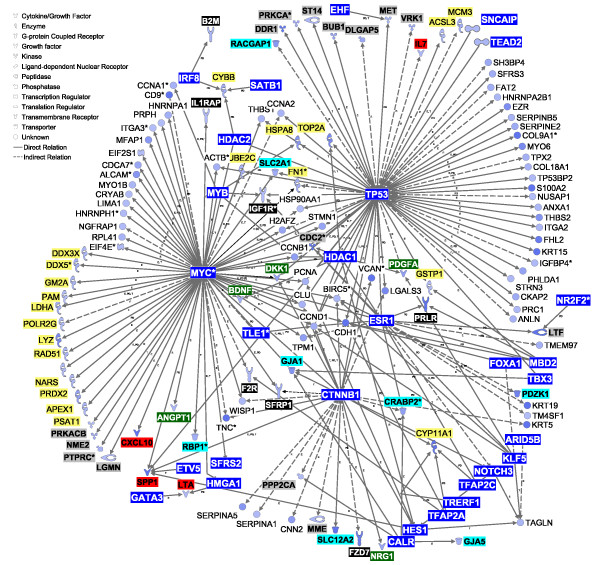
Figure 3.
Regulatory network expression in mammary parenchyma. Network analysis using differentially expressed genes (DEG) largely expressed (≥ 1.5-fold) in parenchyma (PAR) vs. mammary fat pad (MFP). The interactions shown involve the effect on expression (E), transcription (T), and protein-DNA interactions (PD) between transcription factors (blue background, white font) and other DEG largely expressed (≥ 1.5-fold) in PAR vs. MFP. Molecule types have their background highlighted as follows: enzymes, yellow; cytokines, red; growth factors, dark-green; membrane receptors, black (white font); kinases and phosphatases, gray; transporters, light-blue. The legend for the shape of the objects is reported in the figure. The intensity of the color in the object is proportional to the fold-difference in PAR vs. MFP.

