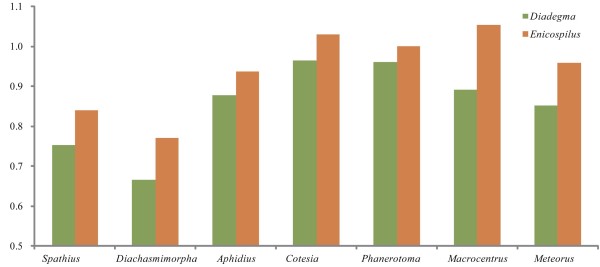
Figure 6.
Evolutionary rates of braconid mitochondrial genomes. The ration of the number of nonsynonymous substitutions per nonsynonymous site (Ka) and the number of synonymous substitutions per synonymous site (Ks) for each braconid mitochondrial genomes, using that of Diadegma semiclausum or Enicospilus sp. as reference sequences.

