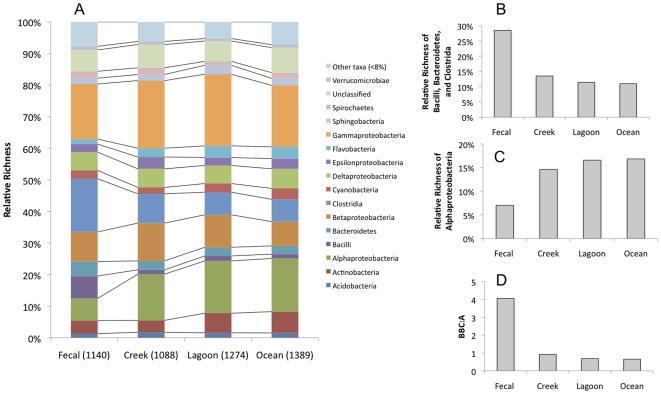
Figure 3. Bacterial community composition comparison across fecal, lagoon, creek and ocean samples.
(A) Distribution of relative richness at the class level. Number of OTUs in each sample types were divided by the total count for each sample type as indicated in parentheses on the x-axis. (B) Relative richness of Bacilli, Bacteroidetes and Clostridia detected. (C) Relative richness of α-proteobacteria detected. (D) Bacillus, Bacteroidetes, Clostridia to α-proteobacteria ratios (BBC∶A).

