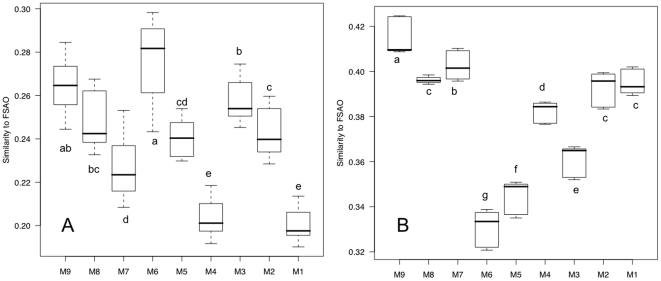
Figure 4. Boxplots of UniFrac similarity metrics between water and fecal-sample-associated OTUs (FSAO).
(A) Variable subpopulations. (B) Stable populations. Each box represents similarity metrics from all 3 days at each site. Boxplots with different letters indicate significant differences (p-value<0.05), compared using the student t-test. The samples were arranged from upstream to downstream (left to right) for samples M9-M4, and M3-M2.

