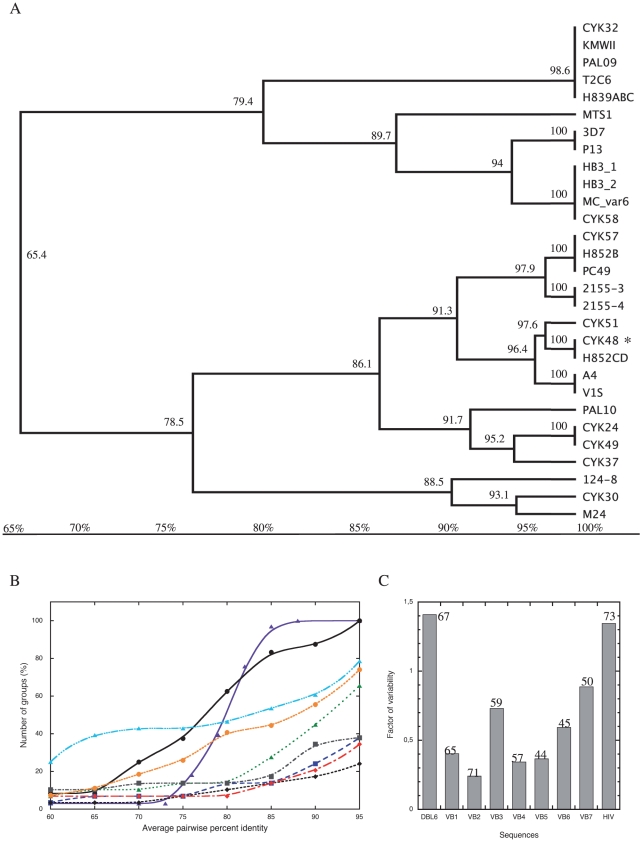
Figure 4. Graphical representation of the low VB variability.
A: Trees were generated for each of the variable blocks in DBL6ε, branch annotations are the average percent pairwise identity (APPI) for VB1 sequences in this subtree. B: For various APPI (on the x-axis), branches (i.e. groups) are counted and marked on y-axis. Graphic representation of variability of the DBL6ε domain (black circle), the envelope protein of HIV (purple triangle), VB1 (blue square), VB2 (black diamond), VB3 (green triangle), VB4 (red diamond), VB5 (gray square), VB6 (light blue triangle) and VB7 (orange circle). In C, a histogram was constructed to determine the variability of the various blocks composed of more than one consensus sequence. HIV represents the histogram obtained with the Env glycoprotein of HIV. For comparison, global APPI of all the sequences are indicated at the top of each histogram.

