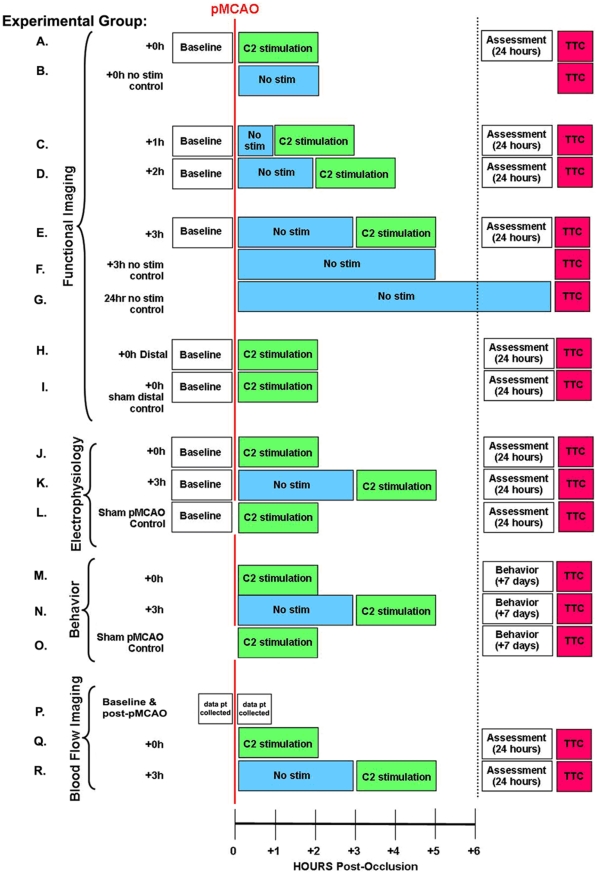
Figure 1. Schematic of the Experimental Design with Constituent Experimental and Control Groups.
For all groups (except sham pMCAO controls that never undergo MCA occlusion) the red vertical line indicates time of permanent occlusion of the MCA (pMCAO), the x-axis at bottom demarcates the chronology of events post-occlusion, and the black dotted line indicates the initiation of all second day experimentation. (Note, however, that the behavior animals are examined for the first time at one week post-pMCAO). (A–L) Experimental paradigms and chronology of events are listed for animals undergoing either functional imaging or electrophysiology (M–O). Chronology of events for animals undergoing behavioral assessment one week post-occlusion (P-R). Experimental paradigms and chronology of events are listed for animals undergoing blood flow imaging. N-sizes for each treatment condition are as follows: (A) n = 7; (B) n = 3; (C) n = 7; (D) n = 8; (E) n = 7; (F) n = 5; (G) n = 2; (H) n = 3; (I) n = 3; (J) n = 3; (K) n = 3;(L) n = 21 (M) n = 22; (N) n = 22; (O) n = 22; (P) n = 13; (Q) n = 6;(R) n = 6.

