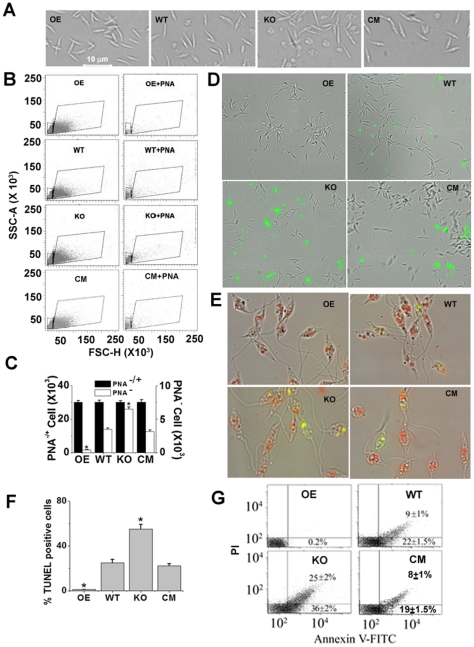
Figure 2. Increased metacyclogenesis and apoptosis in LmAPX null mutants.
(A) Bright field images of OE, WT, KO and CM cells. (B) Stationary phase cells were analyzed by flowcytometry before (left panel) and after (right panel) their purification using PNA. Dot plots of FSC-H (forward-angle light scatter) vs. SSC-A (side-angle light scatter) represent the acquisition of 30,000 events. The gating on the dot-plots corresponds to different cell sizes and forward-angle light scatter (FSC) intensities (FSClow and FSChigh). FSClow (denoted by small box area) represents mainly the metacyclic (PNA−) population. (C) Bar diagram of cell number in the total population (PNA+−) and PNA− populations of the parasites as derived from (B). Error bars represent the SD from three independent experiments. *Statistically significant value of less than 0.001. (D) AnxA5-FITC staining combined with phase-contrast micrographs are depicted of stationary phase promastigotes. (E) TUNEL-staining of cells counterstained with PI in the presence of RNase. Merged image of cells under bright-field. (F) Bar diagram of % TUNEL positive cells in 300 promastigotes. (G) Cells were double stained with annexin A5 and PI and analyzed by flow cytometric analysis. Dot plots are divided in four quadrants. The lower left, lower right and upper right quadrant represent viable cells, early apoptotic and late apoptotic cells, respectively. Percentages of cells are denoted in the corresponding quadrants. All the data are representative of three independent transfection experiments (three different KO clones).

