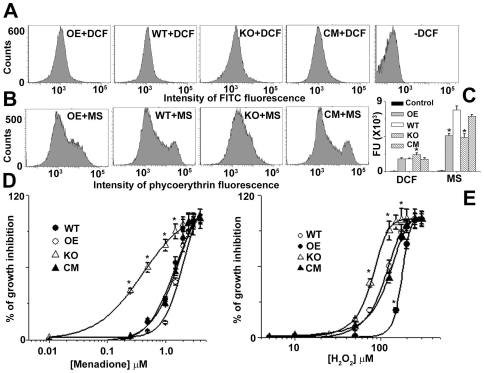
Figure 3. Comparative ROS scavenging study of WT, KO, OE and CM L. major cells.
(A) Flowcytometric determination of intracellular H2O2 by DCFDA. (B) Flowcytometric determination of intracellular superoxide by MitoSox Red (MS). (C) Bar diagram of fluorescence intensities depicted in (A) and (B). Relative change in fluorescence in (A) and (B) was analyzed with FACSDiVa software. (D) and (E) are % growth inhibition in presence of various concentration of menadione and H2O2 respectively. The IC50 value for menadione in KO, WT, OE and CM cells was ∼0.36±0.2, 1.38±1.0, 1.8±0.9 and 1.4±0.5 µM respectively. The IC50 value for H2O2 in KO, WT, OE and CM cells was ∼80±5, 110±4.0 and 175±12, 120±10 µM respectively. All data shown are means ± SEM from three independent experiments. *Statistically significant value of less than 0.05. All the data are representative of three independent transfection experiments.

