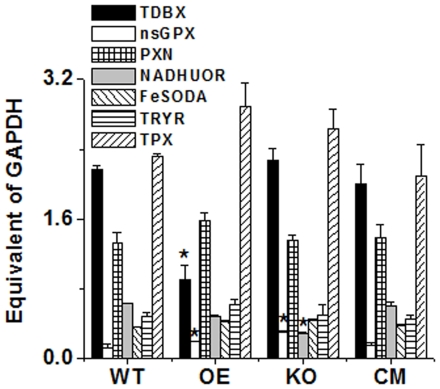
Figure 4. mRNA status of different antioxidant genes in WT, KO, OE and CM in L. major cells.
Measurements of gene transcript abundance was analyzed by using quantitative RT-PCR as detailed under “Material Methods.” nsGPX, non selenium glutathione peroxidase; TDBX, Type-II tryparedoxin peroxidase; PXN, peroxidoxin tryparedoxin peroxidase; NADHUOR, NADH-ubiquinone oxidoreductase; FeSODA, iron superoxide dismutase; TRYR, trypanothione reductase; TRYP5, tryparedoxin peroxidase. All data were normalized using WT cells glyceraldehyde-3-phosphate dehydrogenase gene (GAPDH, LmjF30.2970) as the endogenous control. Data show mean ± SD of three independent experiments. *P<0.05, compared with WT sample. All the data are representative of three independent transfection experiments.

