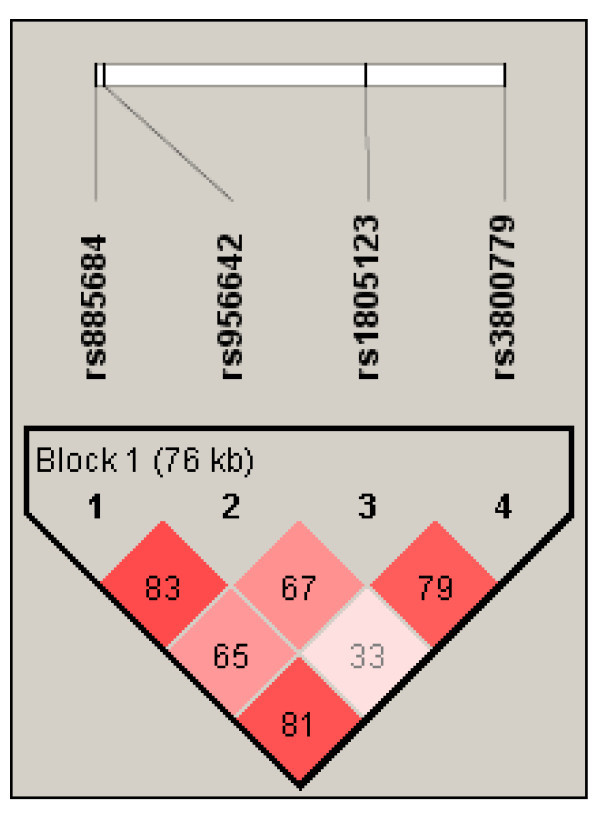
Figure 3.
Linkage disequilibrium pattern of the SNPs along the 7q36.1 region encompassing the HERG1 gene. The graphic illustrates the one distinct haplotype block defined using the Haploview program. The linkage disequilibrium (D') between any two SNPs is shown in the cross cell. The darker the color indicates the higher linkage disequilibrium between any two SNPs. The linkage disequilibrium (r2) between any two SNPs is as follows: rs885684-rs956642: 0.191; rs885684-rs1805123: 0.277; rs885684-rs3800779: 0.122; rs956642-rs1805123: 0.081; rs956642-rs3800779: 0.072; rs1805123-rs3800779: 0.074. SNP, single nucleotide polymorphism.

