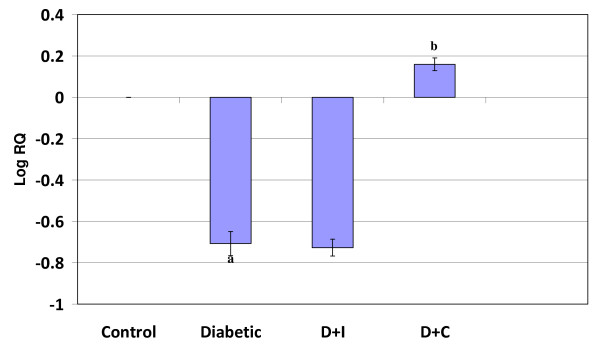
Figure 8.
Real Time PCR amplification of phospholipase C mRNA from the cerebellumof control and experimental rats. Values are mean ± S.D of 4-6 separate experiments. Each group consist of 6-8 rats Relative Quantification values and standard deviations are shown in the table. The relative ratios of mRNA levels were calculated using the ΔΔCT method normalized with β-actin CT value as the internal control and Control CT value as the calibrator. a p < 0.001 when compared with control b p < 0.001 when compared with diabetic group. D+I - Insulin treated diabetic group. D+C- Curcumin treated diabetic group.

