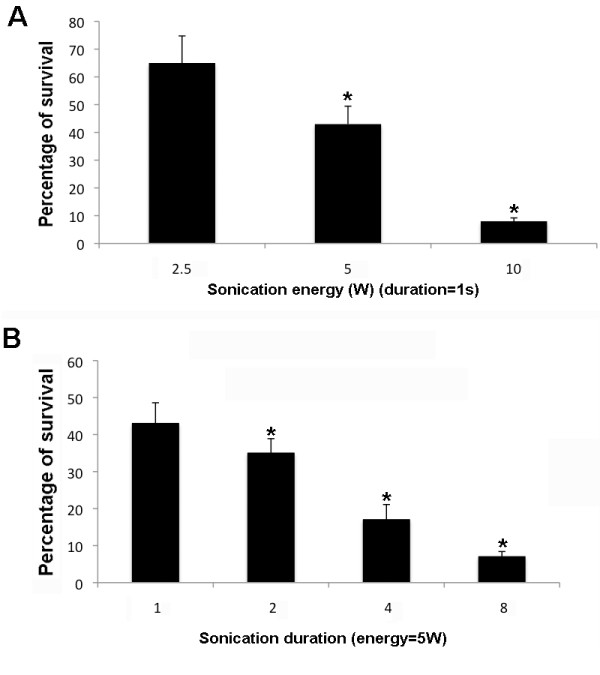
Figure 2.

Cell survival for various sonoporation durations and energy levels. Survival was defined as the number of calcein-positive cells 2 d after sonoporation and expressed as a percentage of the number of calcein-positive cells in the unsonoporated control. Results are expressed as the mean ± SD. *p < 0.05.
