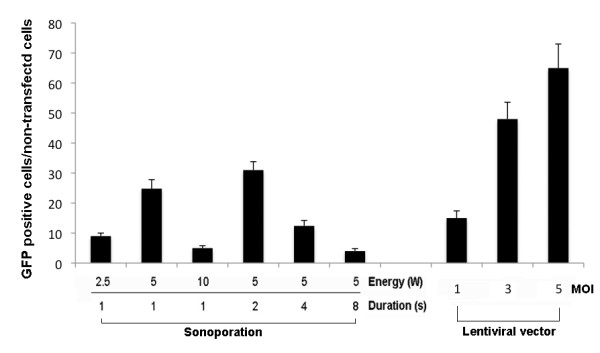
Figure 3.

Comparison of gene transfection efficiency between the sonoporation and lentiviral vector methods. The histogram shows the relative number of transfected GFP-positive cells per 5 mm2 after sonoporation (left side of the panel) and gene transfer using the lentiviral vector (right side of the panel). All DRG cells were derived from the same pool of cells.
