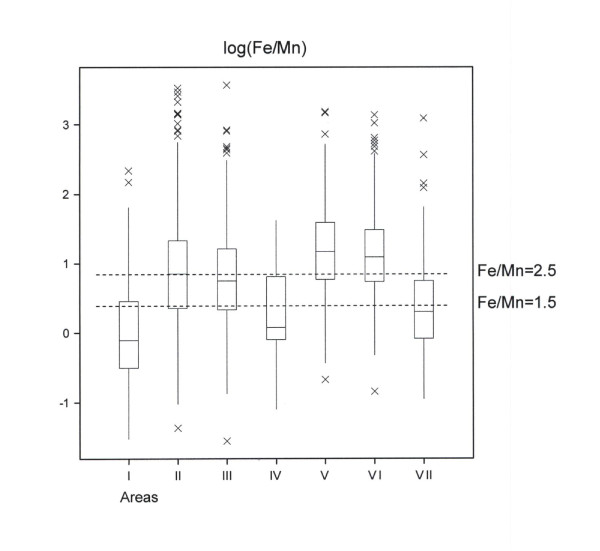
Figure 2.
Boxplot of log(Fe/Mn) in 7 different areas in Iceland (see Figure 1 and text). The boxes span the middle 50% of the data and the horizontal line within each box indicates the median. Whiskers extend to the minimum and maximum values up to a distance of 1.5 times the interquartile range and more outlying points are shown as distinct points. The dotted horizontal lines indicate the interval of favorable ratio of Fe/Mn from 1.5 to 2.5 in plants.

