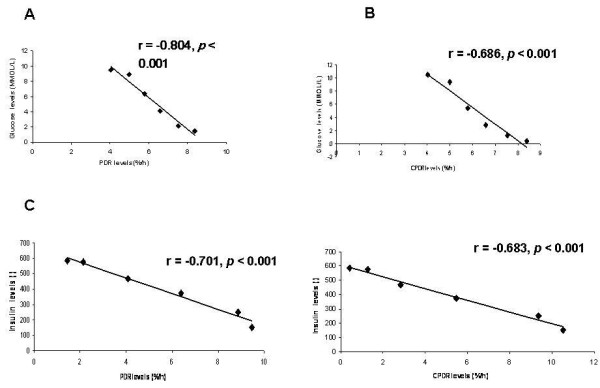
Figure 5.

Correlations between the median value of glucose levels for all patients together every 30 minutes during OGTT and PDR every 30 min. in (A) and (B) for CPDR every 30 min; and correlations between the median value of insulin levels for all patients together every 30 minutes during OGTT and PDR every 30 min. (C); and (D) for CPDR every 30 min.
