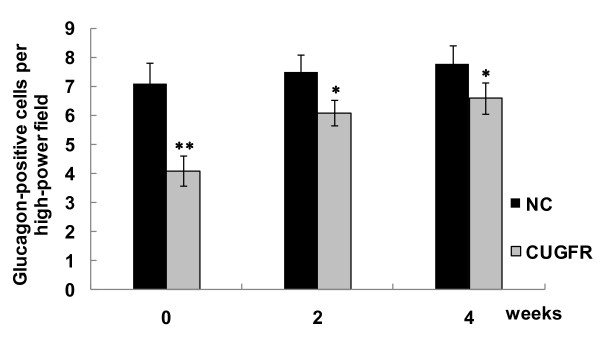
Figure 10.
Effect of catch-up growth on glucagon-positive cells per high-power field. To quantify the expression of glucagon, an average of 50 sections of rat ileum from each of two animals were examined. The number of cells immunoreactive for glucagon was determined. Data are expressed as means ± SD. *P ≤ 0.05 versus NC group; **P ≤ 0.01 versus NC group.

