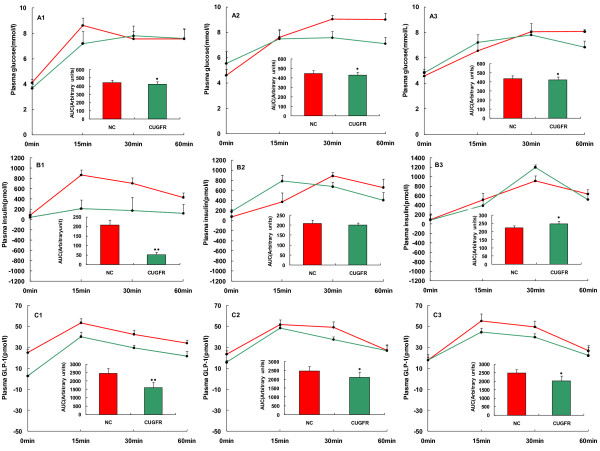
Figure 5.
Effect of catch-up growth on islet function and GLP-1 concentration. Plasma glucose (A), insulin (B), GLP-1(C) levels and AUCInsulin, AUCGlucose, AUCGLP-1 during a 1-hour OGTT, which was conducted 0 (A1, B1 and C1), 2 (A2, B2 and C2) and 4 (A3, B3 and C3) weeks after catch-up growth in the NC (red) and CUGFR (green) groups, were measured. Data are expressed as means ± SD of six rats in each group. *P ≤ 0.05 versus NC group; **P ≤ 0.01 versus NC group.

