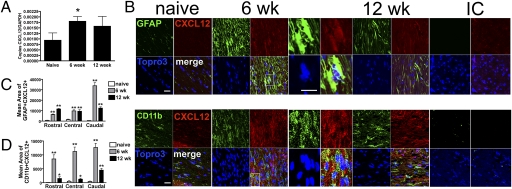
Fig. 1.
CXCL12 expression in the CC after CPZ exposure. (A) qRT-PCR analysis of CXCL12 expression in dissected whole CC derived from naive mice and from mice after 6 and 12 wk of CPZ ingestion. Each group represents three to five individual animals, *, P < 0.05. (B) Confocal IHC analysis of CC from naive mice and after 6 and 12 wk of CPZ ingestion. Images were stained for GFAP or CD11b (green, Upper and Lower, respectively), CXCL12 (red), and nuclei (blue). Higher power images of boxed areas in images from 6-wk time-point are shown. Representative images shown for three sections from three mice in two separate experiments. IC = isotype control. (Scale bars, 25 μm.) (C and D) Quantitation of GFAP+ (C) and CD11b+ (D) cells that express CXCL12 within rostral, central, and caudal sections of the CC in naive mice (white bars) and after 6 (gray bars) and 12 (black bars) wk of CPZ exposure; n = 6 images taken from three to five mice/group. *, P < 0.05 and **, P < 0.005.

