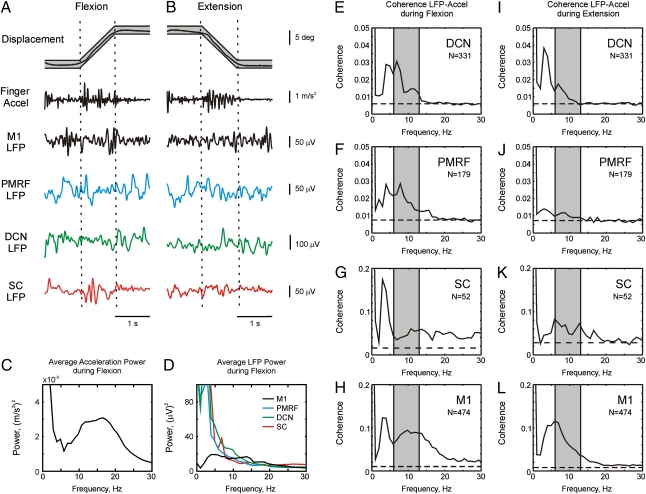
Fig. 1.
(A and B) Raw data showing discontinuities during slow finger movements in monkeys. Examples of raw data during a single trial of the behavioral task. Actual finger displacement (black) is shown against the allowed target window (gray). Finger acceleration is shown, as is LFP from M1, PMRF, DCN, and SC, respectively. (C) Acceleration power during flexion ramp phase of the task. (D) LFP power during flexion ramp from the four different brain areas. (E–L) Coherence between LFP and finger acceleration, averaged over all LFPs and all sessions for different areas of the brain and SC. Coherence was calculated during flexion (E–H) or extension (I–L) tracking movements. Dashed line shows the significance level (P < 0.05). Shaded area shows the 6- to 13-Hz tremor band used for subsequent analysis.

